|
brent harris elliott wave
futures market
advisory service
quarterly report sample page
s&p 500 (jan. 31,
2009)
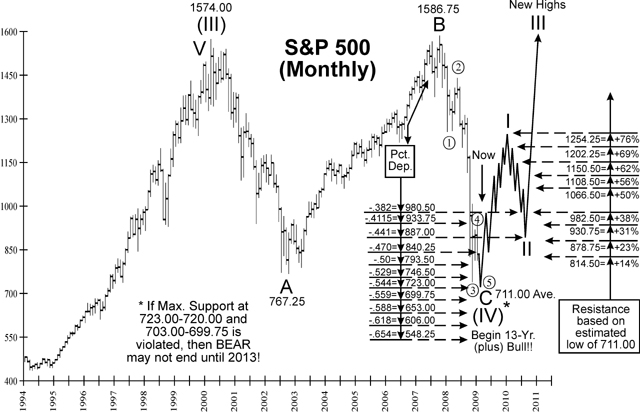 while there is (so far) every
reason to believe that our preferred, long-term count in stocks is correct, in
that a tremendous, super-cycle-wave-four low is either already in place, or it
will be within the next month or so, the short-term pattern is at a rather
critical position...now! in short, because the november-january rally in the s&p
(739.00-942.75) equaled the greatest duration of any other advance since the
october 2007 high, and a fairly sharp-drop immediately followed, the action over
the next week or two should be very "telling". if prices are unable to close
back above key resistance at about 913.50-920.00 by the first, or second-week in
february, then we�ll have to figure that a larger, primary wave-[5] decline is
developing-off the january top. in which case, we should see one last drop to
new lows...probably by late feb.-to-mid-march. our optimum buy-zones for which
(under this scenario) will be at 723.00-720.25 and/or 703.00-699.75 maximum! on
the other hand, however, in the event a close above 920.00 occurs first, then
we�ll have to figure that prices are going to also exceed the january top
(942.75). given this development, since a completed, c-wave decline from the
october 2007 top will be strongly confirmed, we�d have to figure that the
entire, 8 3/4-year bear cycle is already over ,i.e., at the november 2008 low of
739.00. since this count suggests that we are just now entering a primary
wave-[3], of a larger, cycle-wave-one advance, prices could really "explode"
over the next few months. anyhow, either way, as long as we do not see a close
below 699.75 in the s&p, i�m bullish as heck on stocks. if a close below 699.75
does occur, however, things could get a lot uglier....as my "time-analysis" will
then indicate a continuing bear market into 2013.
order brent's quarterly report |